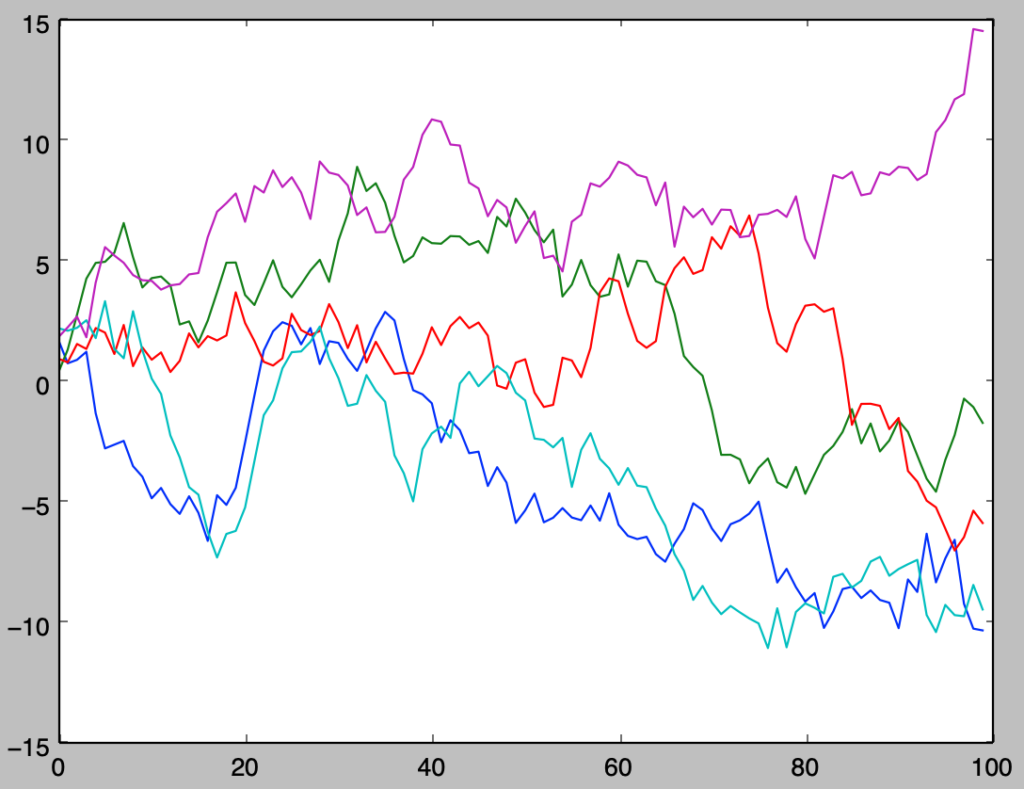
import numpy as np
import matplotlib.pyplot as plt
from scipy import stats

np.random.seed(0)

x = np.arange(0,100,1)
y = np.zeros([x.shape[0],5])

y[0,:] = stats.norm.rvs(size=5)
for i in range(x.shape[0]-1):
    y[i+1,:] = y[i,:] + stats.norm.rvs(size=5)

for i in range(y.shape[1]):
    plt.plot(x,y[:,i])

plt.show()
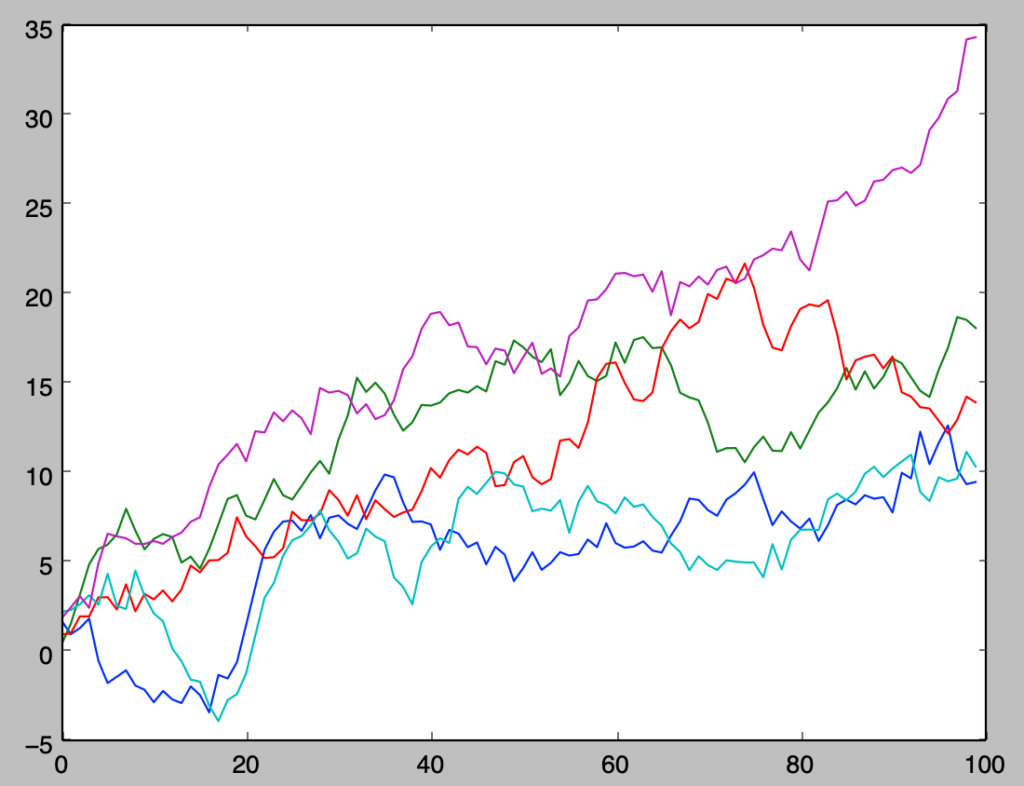
import numpy as np
import matplotlib.pyplot as plt
from scipy import stats

np.random.seed(0)

mu, sigma = 0.2, 1
x = np.arange(0,100,1)
y = np.zeros([x.shape[0],5])

y[0,:] = stats.norm.rvs(size=5)
for i in range(x.shape[0]-1):
    y[i+1,:] = y[i,:] + stats.norm.rvs(mu,sigma,size=5)

for i in range(y.shape[1]):
    plt.plot(x,y[:,i])

plt.show()
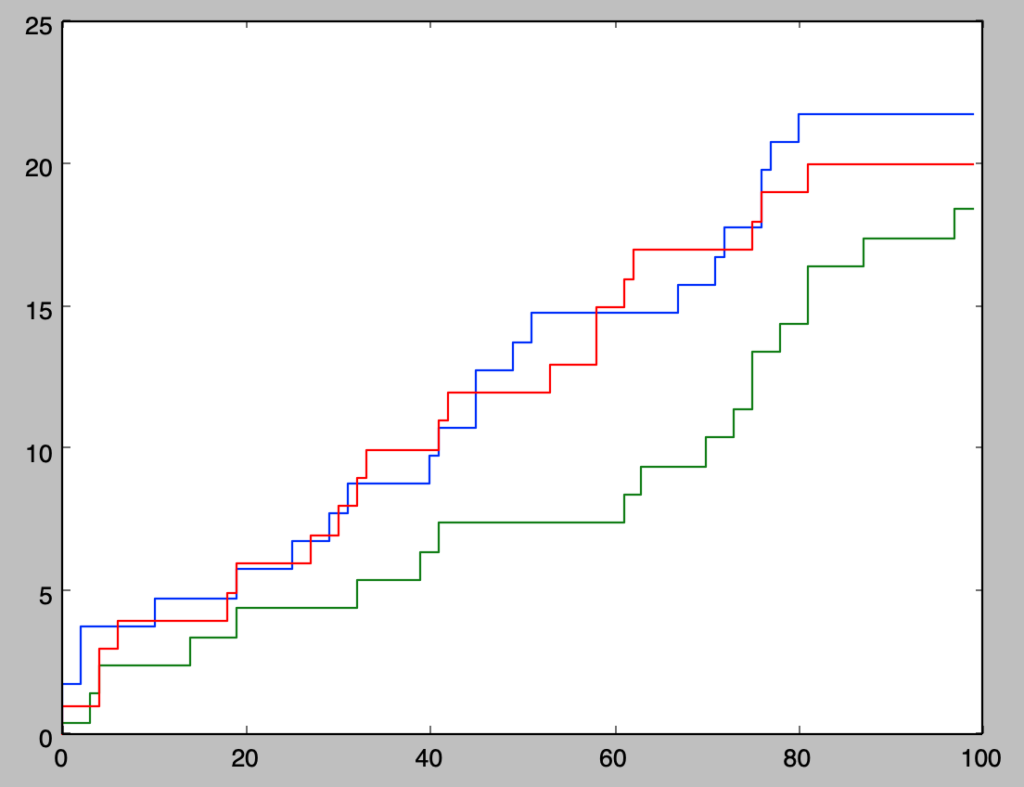
import numpy as np
import matplotlib.pyplot as plt
from scipy import stats

np.random.seed(0)

lamb = 0.2
x = np.arange(0,100,1)
y = np.zeros([x.shape[0],3])

y[0,:] = stats.norm.rvs(size=3)
for i in range(x.shape[0]-1):
    y[i+1,:] = y[i,:] + stats.poisson.rvs(lamb,size=3)

x_ = np.repeat(x,2)
y_ = np.zeros([200,3])
for i in range(1,200):
    y_[i,:] = y[(i-1)//2,:]

for i in range(y.shape[1]):
    plt.plot(x_,y_[:,i])

plt.show()
import numpy as np

x = np.array([30., 20., 52., 40., 50., 35., 60.])
ave_x_A = np.mean(x[0:3])

count_A = 0.
count_all = 0.
for i in range(7-2):
    for j in range(i+1,7-1):
        for k in range(j+1,7):
            count_all += 1.
            if (x[i]+x[j]+x[k])/3. <= ave_x_A:
                count_A += 1.

print("P-value: {}/{}={}".format(int(count_A), int(count_all), count_A/count_all))
import numpy as np

x = np.array([1., 2., 3., 4., 5., 6., 7.])
y = np.array([1., 3., 2., 6., 4., 5., 7.])

P, N = 0., 0.
for i in range(7):
    for j in range(i+1,7):
        if (x[i]-x[j])*(y[i]-y[j])>0:
            P += 1.
        else:
            N += 1.

cor_spear = 1. - 6.*np.sum((x-y)**2)/(7.*(7.**2-1))
cor_kendall = 2*(P-N)/(7.*(7.-1.))

print("Spearman correlation coef: {}".format(cor_spear))
print("Kendall correlation coef: {}".format(cor_kendall))